Student Project – Coral Fluorescence Imaging and Spectroscopy
Walt Whitman High School (Huntington Station, NY) has a great program for students who are interested in research – they can undertake a year-long independent project in science, math or technology. The focus for any of these projects is a coral aquaculture system that was established by WWHS science research teachers Frederick Feraco and John Karavias in collaboration with Joe Racioppi and Paul Olsen from Fishlife Aquarium in South Huntington (read more here). As all reef aquarists know well, establishing and maintaining a healthy salt water system involves a lot of science and engineering – the physical structure of the system and its pumps and filters, the chemistry of the water, the biology of the corals and algae, and many more factors all have to work in concert.
With the system established you can do research on the corals themselves. This year (2021-2022) 10th grade students Nathalie Alvarez and Mason Peretson have been researching the spectral properties of coral fluorescence. Using a stereo microscope, a NIGHTSEA SFA system with Ultraviolet, Violet, and Royal Blue excitation/emission sets, and an Ocean Insight spectrometer, they have been imaging various coral species and measuring fluorescence emission spectra. Below is an example of a summary page for one specimen, a Green Finger Leather Coral, Sinularia flexibilis.

Some specific examples are shown here.
(Click any image for larger view)
Sinularia flexibilis – Green Finger Leather Coral
-

- Sinularia flexibilis

-

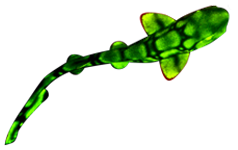
- Sinularia flexibilis fluorescence – Violet excitation

-

- Sinularia flexibilis fluorescence – Royal Blue excitation

-

- Sinularia flexibilis emission spectrum – Violet excitation

-

- Sinularia flexibilis emission spectrum – Royal Blue excitation

This example illustrates some interesting things about fluorescence observation and measurement. You can see that the fluorescence under the NIGHTSEA Royal Blue excitation appears more green than the fluorescence under the Violet excitation. This is because when you use the Royal Blue you are viewing through a barrier filter that cuts off light with a wavelength shorter than about 500nm, while with the Violet the barrier filter cutoff is at about 450nm. Translated into plain language, that means that the Violet barrier filter is able to transmit more blue light than the filter used with the Royal Blue, resulting in a more cyan appearance if there is light present at these shorter wavelengths.
This visual effect corresponds to what you see in the spectral data, which was measured with the spectrometer’s fiber optic probe looking through the same barrier filters. With Violet excitation the emissions spectrum starts to rise at about 480nm, with the peak at about 500nm. With Royal Blue excitation the spectrum is only just beginning to rise at about 500nm, and the peak is shifted to about 530nm. This is not a ‘real’ peak. The left edge of this curve is determined not by the emission properties of the coral, but rather by the transmission properties of the barrier filter, which is simply cutting off that portion of the emission below 500nm. The shape of the spectrum measured with Violet excitation is real because the left side of the spectrum is not affected by the transmission properties of the filter.
See how much there is to learn from a measurement like this?
Acropora microclados – Green Acropora
-

- Acropora microclados

-

- Acropora microclados fluorescence – Violet excitation

-

- Acropora microclados emission spectrum – Violet excitation

This specimen makes a nice comparison with the Green Finger Leather Coral. The color is greener under Violet excitation and from the emission spectrum we see that this is a ‘true’ green. The spectrum rises slowly at about 480 then ramps up quickly to a sharp peak at about 510nm. This is characteristic of the ‘Green Fluorescent Protein’ (GFP) family that was originally discovered in a jellyfish and later was found to also be present in corals. (GFP and related proteins are incredibly important in many areas of biological and pharmaceutical research – you can learn more here.) The peak at ~480nm that we see under Violet excitation in the Green Finger Leather Coral is characteristic of what is called Cyan Fluorescent Protein (CFP), another important protein in the same family. The initial rise in the spectrum of the Acropora suggests that there might also be some CFP present in this specimen. It is not uncommon for corals to express more than one type of fluorescent protein.
Another feature worth noting in this emission spectrum is the smaller peak at a wavelength of about 685nm. This emission is characteristic of chlorophyll, which is present in the algae (zooxanthellae) that live symbiotically within the coral tissues.
Xenia elongata – Pulsing Xenia
-

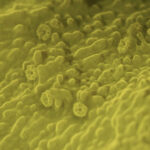
- Xenia elongata

-

- Xenia elongata fluorescence – Royal Blue excitation

-

- Xenia elongata emission spectrum – Royal Blue excitation

This specimen, a soft coral, does not have any of the fluorescent proteins found in the coral tissues. The pale red color you can see in the fluorescence photo under Royal Blue excitation show the red color arising from the chlorophyll fluorescence. We can see that very clearly in the emission spectrum, with its characteristic peak at 685nm. Note also the ‘shoulder’ at 730nm. Without going into too much detail here, chlorophyll has two ‘photosystems’, appropriately named Photosystem I and II, that deal with different parts of the photosynthetic process. The 685nm peak arises from Photosystem II, while the 730nm peak arises from Photosystem I. With appropriate instruments, more sophisticated than the simple spectral measurement shown here, a lot can be learned about plant stress and health from the fluorescence emissions from the two photosystems.
Montipora capricornis – Red Montipora
-
- Montipora capricornis fluorescence – Royal Blue excitation

-

- Montipora capricornis emission spectrum – Royal Blue excitation

The fluorescence of this coral under Royal Blue excitation appears yellowish, and we can see this in the measured emission spectrum. The dominant emission peak is at about 580nm, in the yellow portion of the spectrum. You can also see the 685/730nm peaks from the chlorophyll photosystems.
Congratulations to Nathalie and Mason, and all the other students in the Walt Whitman High School research program. We hope to see more in the future from these young scientists.
WWHS students and teachers are always willing to collaborate on new research projects especially relating to coral biology. If you would like to get involved please email fferaco@shufsd.org.